Campaign Analytics: See Exactly Where Your Funnel Makes (and Loses) Money
Explore the native analytics suite for NEXT Campaigns and learn how to use the data to drive CRO
Is this specific funnel converting, and where is it losing shoppers?
These are the questions that marketers constantly ask themselves once a campaign is live. Traffic shows up in a dozen tools already, but what’s harder to see is what happens after someone lands: which pages hold or lose them, and whether the answer changes by device or browser.
The analytics pages inside NEXT’s Campaigns app are where they get answered. Analytics are tracked on every NEXT campaign built on the Campaign Cart SDK and it goes deeper than session counts and pageviews — down to the page, the device, and the dollar.
Campaign Data Overview
When you navigate to the Campaigns app dashboard, you’ll see a list of each of your campaigns along with a set of top-level stats. These stats show aggregate data over the past seven days as well as a comparison against the previous period’s numbers.
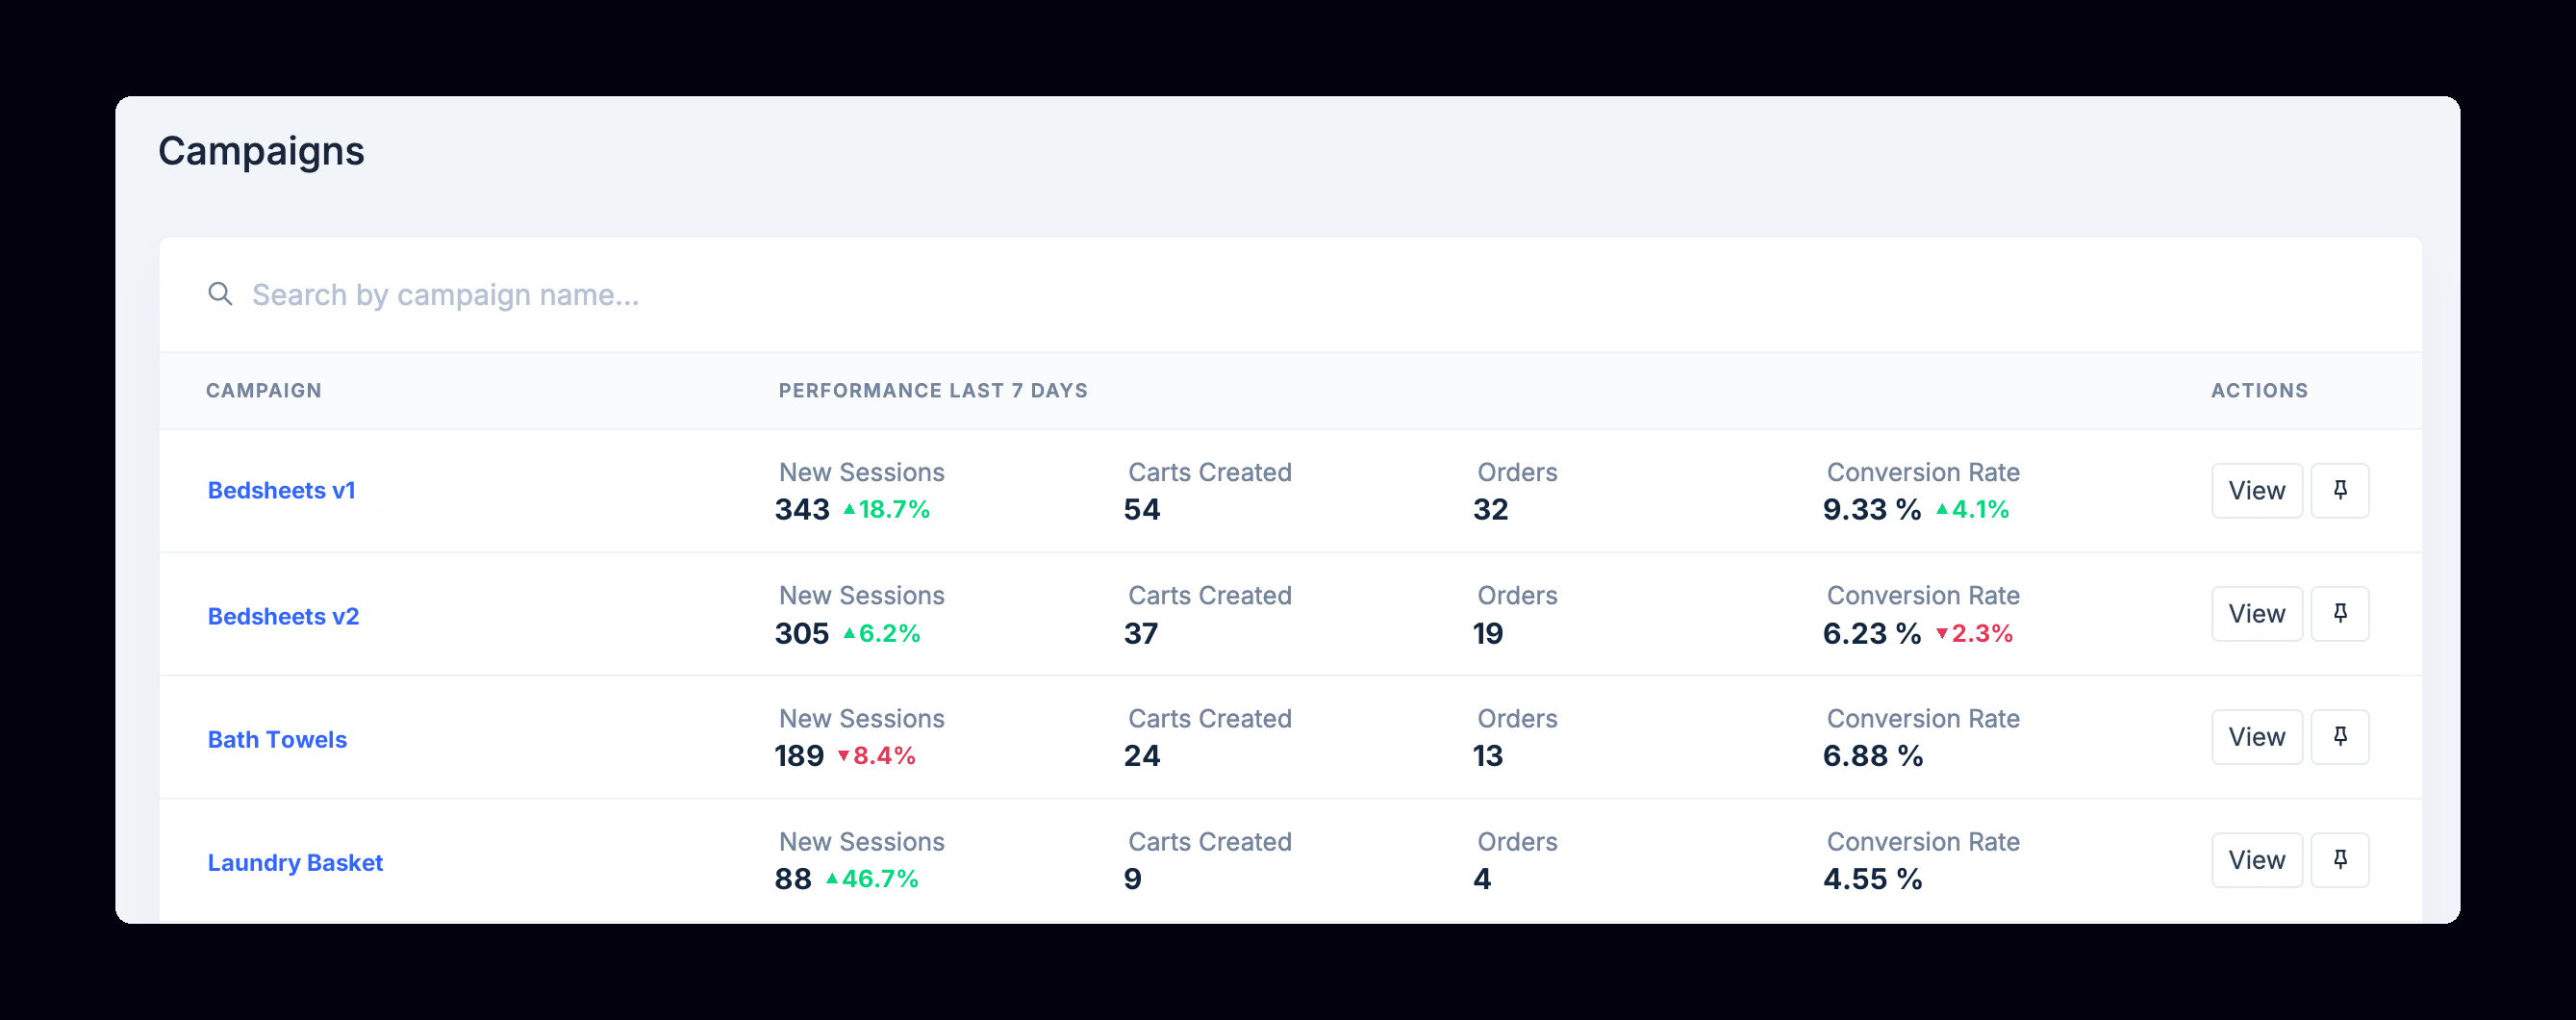
This view is helpful when comparing different versions of the same campaign against each other. When you want more details about each campaign, including per-page performance data, simply click “View” on an individual campaign.
Per-Campaign Tracking Data
Seven core metrics track automatically on any funnel running the SDK, no extra setup required. Active Visitors is live; the other six are filterable by date range:
- Active Visitors — who’s on the page right now
- New Sessions — unique sessions on the campaign in the date range you’re viewing
- Carts Created — carts created through the Campaigns API (an event that includes the customer’s name, email address, session data, products, quantity, price)
- Orders — completed orders in that same date range
- Sales — total sales revenue generated, including post-checkout upsell revenue
- Conversion Rate — the share of sessions that turn into a sale
- AOV — average order value, sales total divided by number of orders
Note: If you’ve built a custom funnel without it, session tracking isn’t automatic — you’ll need to drop a tracking script onto each page yourself to light up analytics for it.
Click a metric to see its trend for the period. (Sample data.)
Events by Page: Where the Money Actually Gets Made
On a granular level, Events by Page breaks out every URL in the funnel individually — unique visitors, carts, orders, and upsells, each with its own rate, plus the revenue attached to orders and upsell orders on that specific page. You can also click into a page to see it live in a new tab.
Say your funnel is testing two landing page variants, feeding into one shared checkout, followed by two upsell variants — a given shopper only ever sees one version of each, not all four. From this view, you see the actual outcome of a given page, in that funnel, during that window and can make CRO adjustments appropriately. You know exactly which variant to adjust instead of blindly tinkering with the whole funnel and hoping.
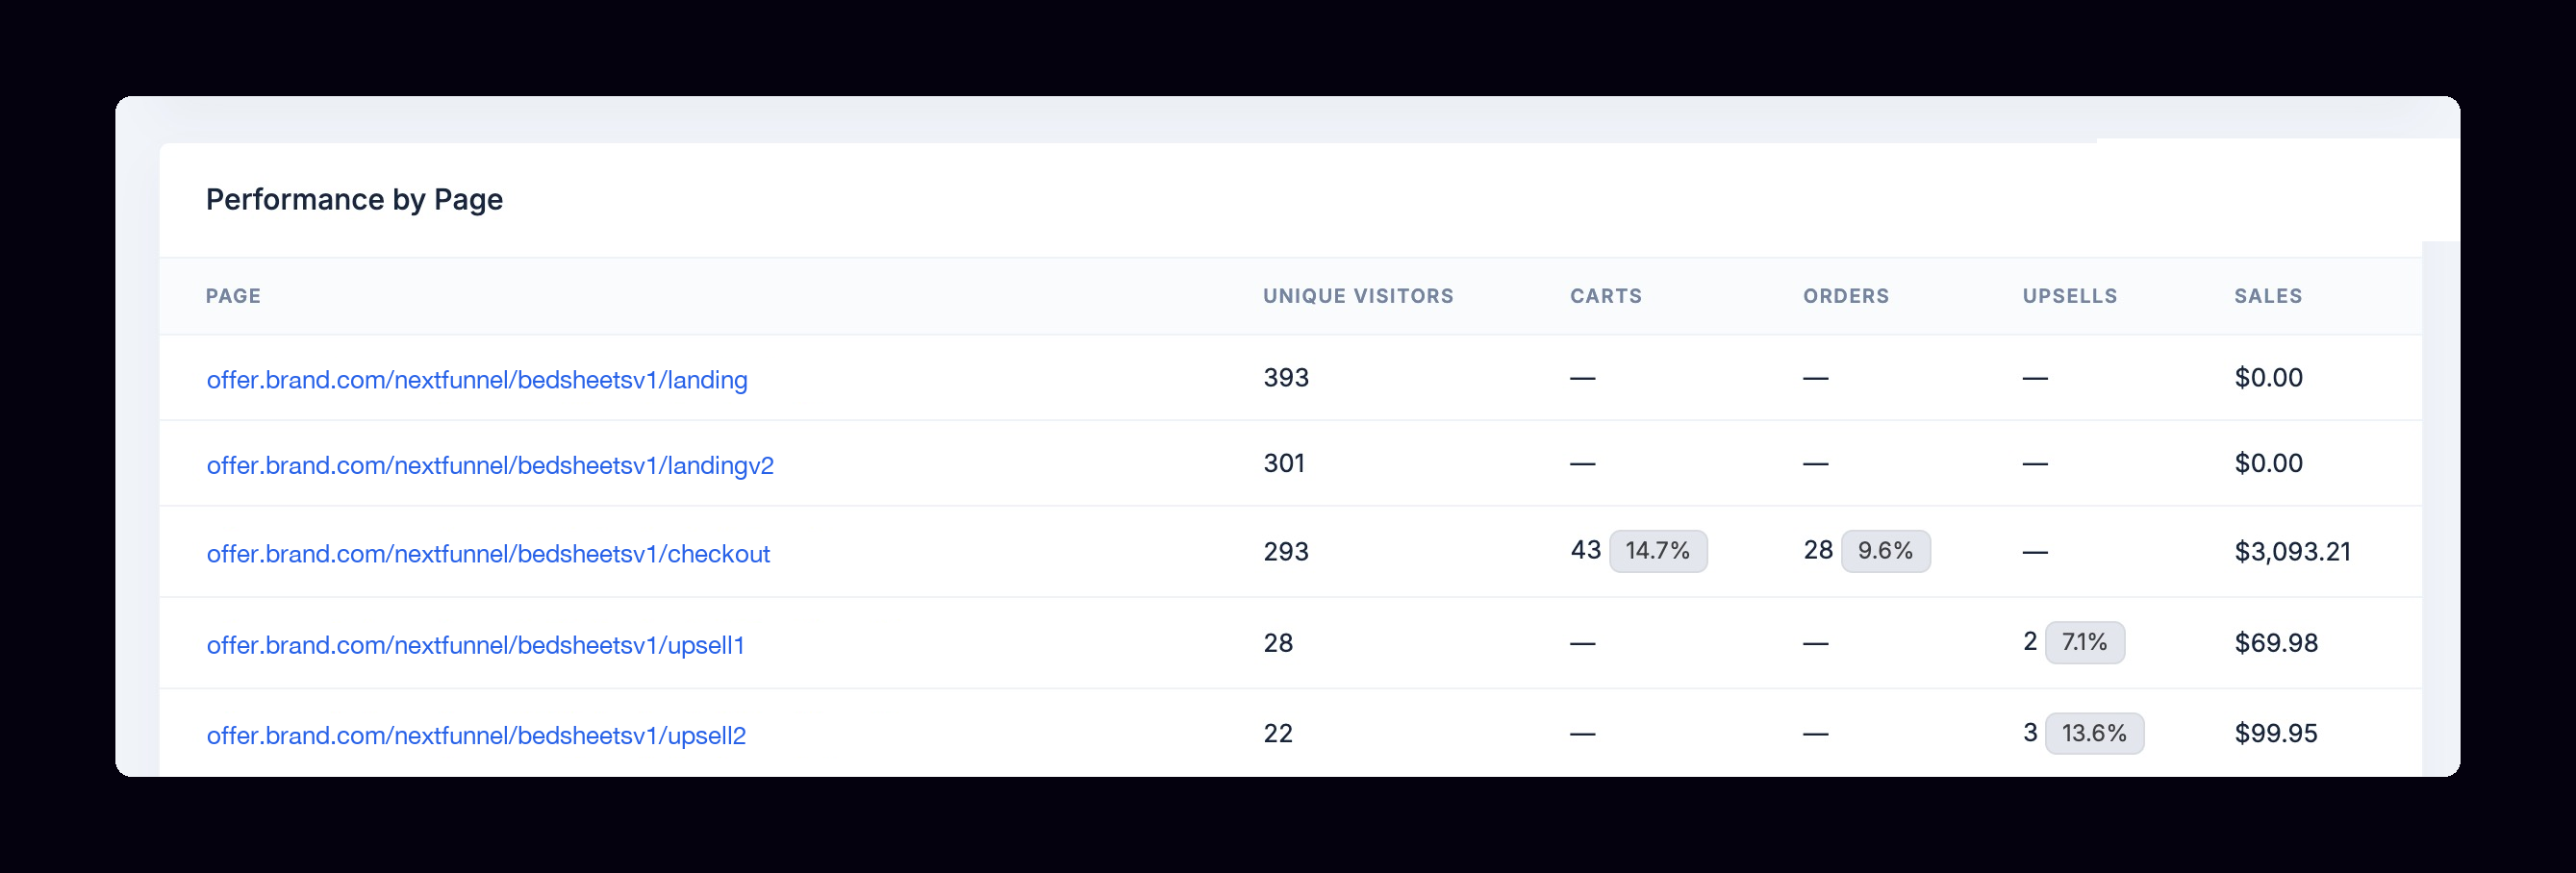 Every URL in the funnel, broken out by visitors, carts, orders, upsells, and revenue.
Performance by Device & Browser
Sometimes your offers and marketing are effective, but there might be a technical reason why a page isn’t converting. A funnel can post a perfectly respectable conversion rate in aggregate while converting fine on desktop and quietly falling apart on mobile Safari, or having one specific browser tank checkout completion while nobody notices.
Performance by Device & Browser splits traffic and conversion rate out by device type and browser, so that gap shows up instead of averaging itself away. If checkout is broken on one browser, this is where you’d see it in the data.
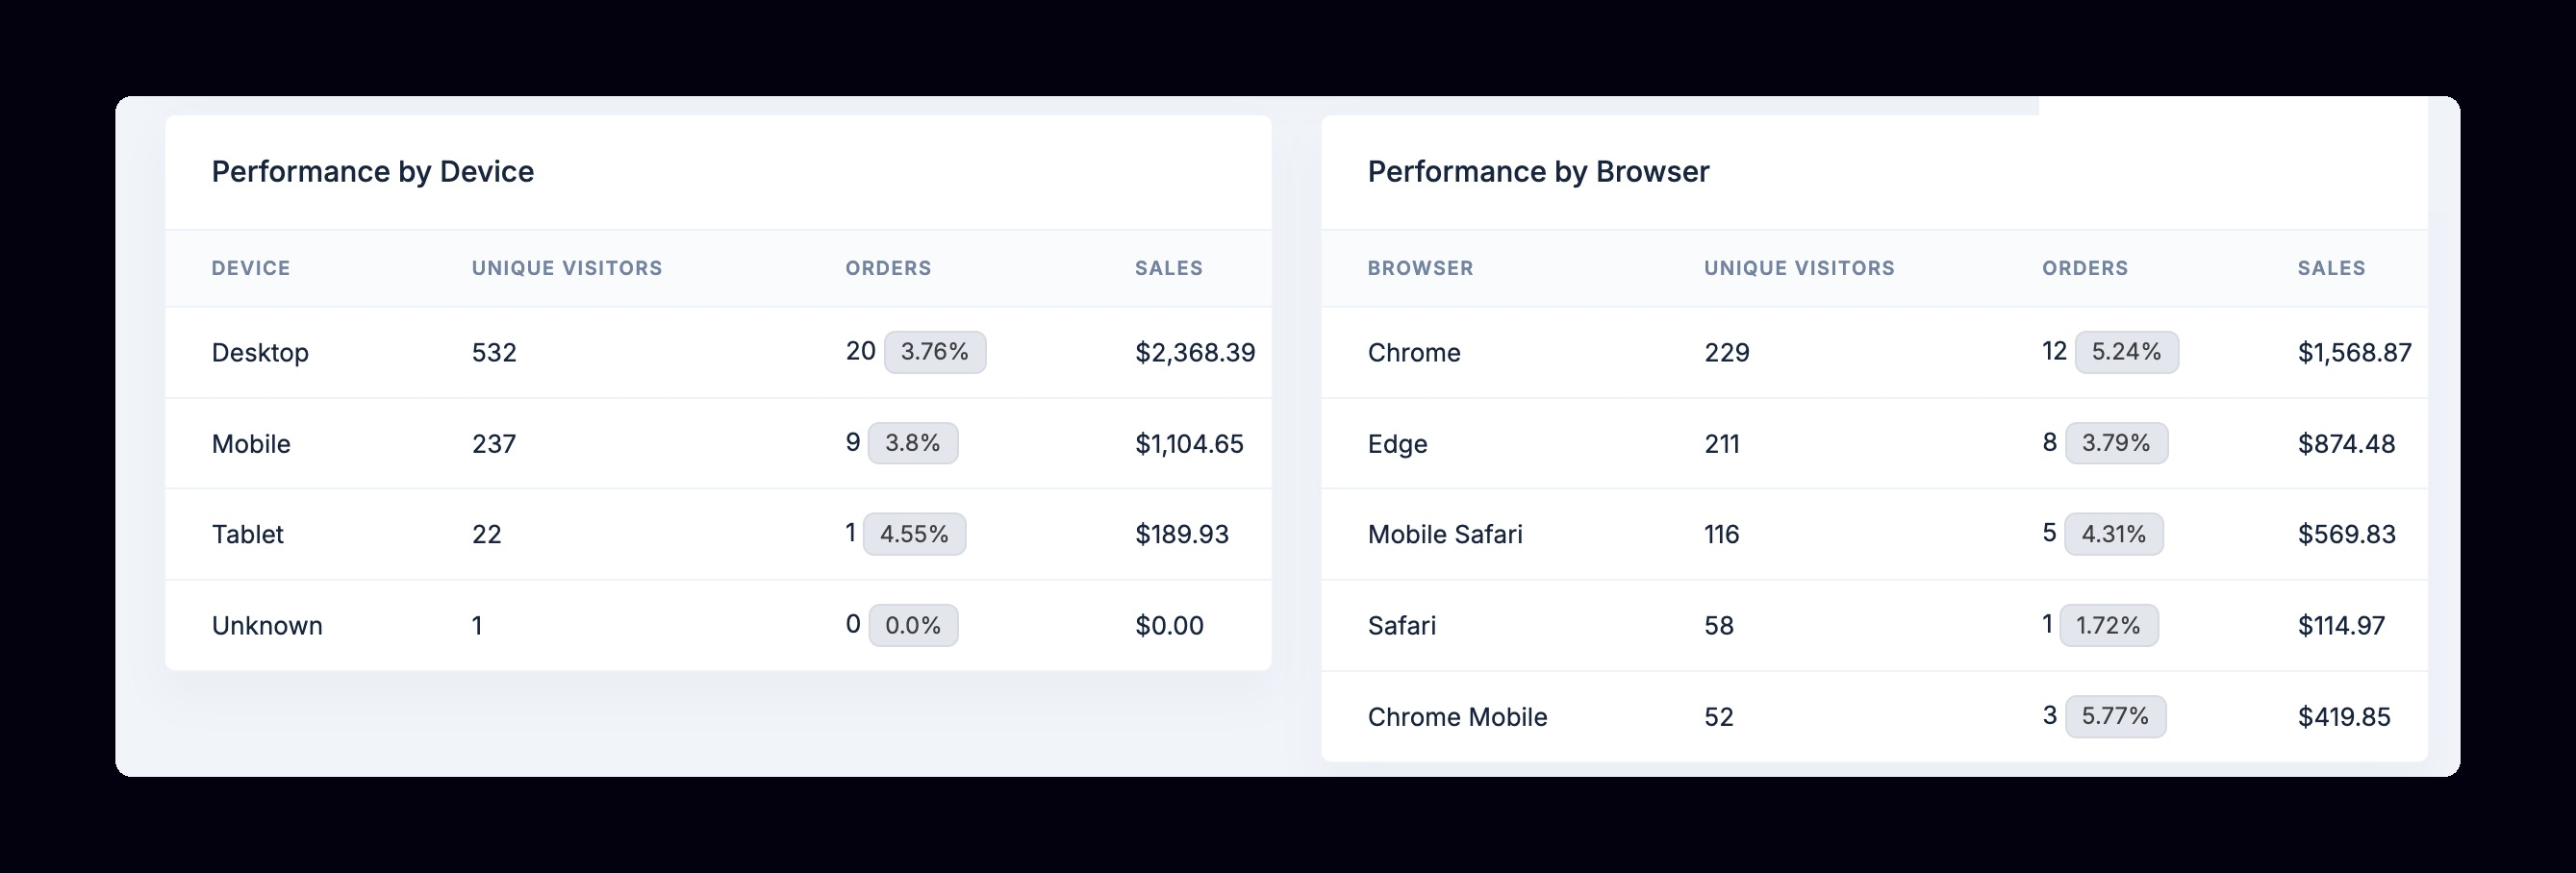 Where a funnel is quietly underperforming on a specific device or browser, instead of hiding inside a blended average.
Use Alongside 3rd-Party Trackers
The SDK can forward campaign events to supported analytics providers, including GTM and RudderStack. Events include campaign and session identifiers, plus coupon and discount amounts when available, so you can use these fields in your existing reporting.
Configure your chosen provider and check its event mapping to make sure the data reaches your destination as expected.
When Something’s Not Tracking, You’ll Know
One common issue in an analytics setup is when a number is sitting at zero and nobody is sure if that’s real or means something broken. That’s a different surface from the dashboard above: the Campaign Cart SDK has its own built-in debug panel, in-page on the campaign itself — an event timeline and delivery status — so you can check whether events are actually firing instead of wondering.
The SDK backs that up on the setup side — it flags missing API keys, incomplete provider configuration, or a script that failed to load. It’s the difference between catching a tracking gap the day it happens and finding it three weeks later when someone asks why last month’s numbers look thin.
These analytics pages are viewable inside the Campaigns app on every NEXT Store and provide a vital first few layers of data for any marketing and CRO team. Full metric definitions and setup details are in the Campaign Analytics docs.